Jan
2022
Board Games
DIY Investor
2 January 2022
This is not substantive investment research or a research recommendation, as it does not constitute substantive research or analysis. This material should be considered as general market commentary.
 Investment trust boards talk a good game about championing shareholders interests – but do they really deliver?
One of the key attractions of closed-ended funds is – in our biased view – the role of the board. Investment trust boards wield the power to overhaul the investment strategy, hire and fire investment managers, and negotiate commercial terms with these managers.
It is fair to say the environment for active managers is becoming more competitive, with the rise of passive funds, of actively managed/specialist ETFs and easier access to open-ended funds via online platforms. This week’s announcement of the merger of Scottish Investment trust into JPMorgan Global Growth & Income is the latest in a number of high-profile manager changes. We set out to see whether there is evidence of an uptick in activity by boards in recent years, including changes of manager. We examine fees, manager and mandate changes and find some evidence activism is on the rise.
Boards: open versus closed-ended funds
Investment trust boards are typically made up of a group of experienced individuals with a mixture of professional backgrounds such as corporate management (e.g. former CEOs, CFOs, COOs), asset management, accounting and law. In addition, more specialist trusts may have experts sitting on the board, for example medical professionals sitting on the board of a healthcare or biotech trust.
The boards of open-ended funds, however, are typically not made up of individual directors but are headed by an ‘authorised corporate director’ (ACD), which is itself an incorporated legal entity. Critically, an ACD is appointed by the fund manager, being either an in-house subsidiary of the fund management firm or a third-party fund administration company.
The ACD’s primary role is merely ensuring the fund complies with relevant regulations and oversight of operational matters such as fund record keeping. The same ACD can carry out this function for dozens or even hundreds of funds. ACDs will not involve themselves with strategic or commercial matters such as setting the investment mandate, fee level or replacing a manager failing to meet expectations.
Until relatively recently, little attention was paid to the role of ACDs in open-ended funds; they tended to sit in the background and, frankly, kept the paperwork in good order. This changed dramatically with the Woodford scandal. In the following FCA review it was required that ACDs ensure 25% of their own boards are made up of independent non-executive directors.
Whether this will generate enough challenge in the future to prevent a similar scandal is a matter of debate. Either way, ACDs will continue to have to manage the conflict of interest between being either a part of the same group as the investment manager or a fund administration company seeking to maintain or grow their business relationships with the fund management firm.
Management fees
An obvious area where independent boards can serve the interests of shareholders is in negotiating the best commercial terms possible (i.e. the lowest fees!) with the investment manager. Fund managers benefit enormously from economies of scale: from their perspective it essentially costs the same to run a £100m portfolio as a £1bn portfolio, so fees on assets under management become highly profitable beyond certain thresholds.
To share some of this benefit with shareholders, boards can negotiate a lower fixed management fee as a trust gets larger (the more AUM a trust has, the better the bargaining position of the board) or a board can negotiate a tiered fee scale whereby the management fee rate drops as the assets of the trust grow.
In fact, with a tiered management fee an investor will be seeing their overall costs of investment (calculated as the OCF) fall even faster with growth in AUM, as on top of the management fee there are other fixed running costs of a trust (such as paying the board) that will be spread across a larger asset base.
Making investment trusts cost effective for investors has become ever more important in recent years with the rise in the competition from passive vehicles, especially ETFs. We have previously noted that boards are often demanding a more active, differentiated approach from managers to remain relevant and improve performance; being cost effective is another important part of this equation.
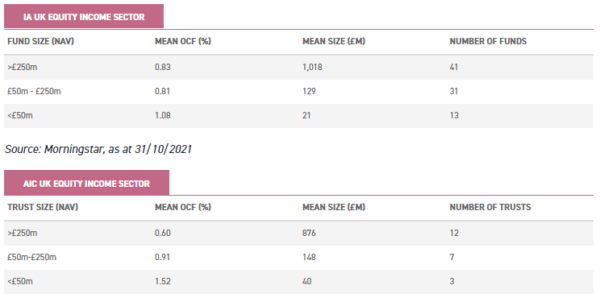
As an example, consider the UK Equity Income sectors for closed and open-ended funds (as defined by the AIC and IA respectively). The table below shows that open-ended funds with a middling AUM of £50m – £250m have nearly the same OCF as larger funds with AUMs over £250m, meaning investors on average are gaining no benefits from economies of scale beyond a certain threshold.
In contrast, investment trust shareholders continue to see average costs fall as trusts become larger, such that larger investment trusts (over £250m) in this space are cheaper than their open-ended peers by an average of 23bps. This reflects the fact that nine of the 22 trusts have a tiered fee structure in the sector, and we note where there isn’t a tiered fee in a larger trust the fixed fee tends to be quite low.
Source: JPMorgan Cazenove, as at 13/10/2021
We have previously discussed the falling average cost of investing in investment trusts, and our analysis suggests the trend continues. In the following chart we show the year-on-year change in average OCFs in the conventional equity sectors from 2014 to 2020. The average investment trust sector fell in cost by 17bps over this timescale.
This is larger than the average fall per trust (11bps) as some of the largest declines were concentrated in smaller sectors, for example the single largest fall was in the relatively small North American Smaller Companies, the average cost falling by 70bps over the whole period. A notable sector was UK All Companies, a large sector with nine trusts, where costs declined by over double the average (24bps).
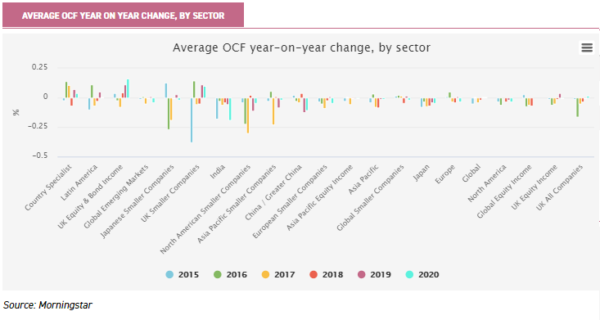
To provide context, the absolute OCF figures for 2014 and 2020 and the change over the time period are provided in the table below. Only three sectors have failed to see a fall in overall costs – and these are small sectors which have seen funds switch in and out – with the largest sectors (UK All Companies, UK Smaller Companies, UK Equity Income, Global and Global Emerging Markets) all seeing material declines in costs, a major factor being boards pushing down management fees to the benefit of shareholders.
OCF BY SECTOR, 2020 VERSUS 2014
| AIC SECTOR | 2014 OCF (%) | 2020 OCF (%) | CHANGE | NUMBER OF TRUSTS |
| North American Smaller Companies | 1.73 | 1.04 | (0.70) | 2 |
| India | 1.72 | 1.17 | (0.55) | 4 |
| Japan | 1.21 | 0.88 | (0.34) | 6 |
| Japanese Smaller Companies | 1.59 | 1.27 | (0.32) | 4 |
| Asia Pacific Smaller Companies | 1.32 | 1.03 | (0.29) | 3 |
| UK All Companies | 0.95 | 0.71 | (0.24) | 9 |
| China / Greater China | 1.23 | 1.00 | (0.24) | 3 |
| European Smaller Companies | 1.21 | 0.98 | (0.23) | 4 |
| Asia Pacific | 1.14 | 0.94 | (0.20) | 6 |
| North America | 1.02 | 0.84 | (0.18) | 5 |
| Global Equity Income | 1.01 | 0.84 | (0.17) | 7 |
| UK Smaller Companies | 1.36 | 1.22 | (0.13) | 18 |
| UK Equity Income | 0.92 | 0.82 | (0.10) | 22 |
| Asia Pacific Equity Income | 1.04 | 0.95 | (0.09) | 5 |
| Global | 0.95 | 0.86 | (0.09) | 17 |
| Global Emerging Markets | 1.37 | 1.28 | (0.09) | 13 |
| Europe | 0.90 | 0.87 | (0.03) | 8 |
| Latin America | 1.60 | 1.57 | (0.03) | 2 |
| Global Smaller Companies | 0.92 | 0.93 | 0.01 | 5 |
| UK Equity & Bond Income | 1.20 | 1.46 | 0.26 | 2 |
| Country Specialist | 1.43 | 1.70 | 0.27 | 5 |
| Total | 1.12 | 1.01 | (0.11) | 150 |
Source: Morningstar
Hiring and firing investment managers
Another major area where an investment trust board can act on behalf of investors is terminating an investment manager that is failing to meet expectations. This is a decision that is never taken lightly. It is a truism of active investing that virtually any strategy will undergo periods of underperformance and simply chasing short term performance is a recipe to destroy investors’ capital. However, if a board loses confidence in a manager, or thinks a different strategy offers greater chance of success, then engaging in a manager selection exercise is an option.
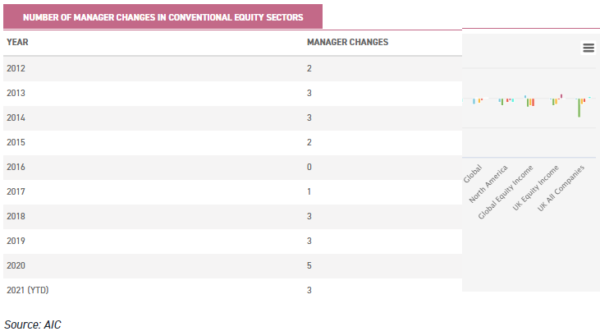
We set out to see whether there had been an increase in manager changes in recent years, and we find there is some evidence. In the conventional equity sectors, 2020 saw the highest number in a single year over the past decade (we have excluded nominal manager changes due to manager corporate actions). In 2021 there have been three already, and the three-year average is the highest it has been over the decade. However, we would argue it is too early to say whether 2020 was just a single bumper year or the start of a new trend, but it is certainly something to watch.
The largest trust to appoint a new manager over this period was Alliance Trust (ATST) which switched to a multi-manager model in April 2017 (when the NAV stood at £2.6bn). ATST’s board appointed Willis Towers Watson as investment adviser to select a portfolio of ten underlying fund managers. Since then (to 30/09/2021) the trust has achieved its objective of outperforming its benchmark, albeit modestly by c. 1.5% (on a NAV basis), a significant improvement on the c. 5% underperformance during the five years prior to April 2017. Interestingly the multi-manager approach has navigated recent market conditions particularly well.
A more recent change was the decision by the board of European Investment Trust (EUT) to terminate fund manager Edinburgh Partners and appoint Baillie Gifford (the official handover occurred on 30/11/2019). The trust was subsequently renamed to Baillie Gifford European Growth (BGEU). This was a high-profile change as it cut to the heart of a long-standing debate between ‘value’ and ‘growth’ managers, Edinburgh Partners being very much committed value investors and Baillie Gifford being strong advocates of a growth style.
For the five years prior to 30/11/2019, the growth led market was a strong headwind for Edinburgh Partners, who underperformed their benchmark by 27.5%. In contrast, from 01/12/2019 to 30/09/2021 Baillie Gifford has outperformed its benchmark by 49.1%, notwithstanding the value rally in Q4 2020.
We would add a note of caution that manager changes may not always have such positive immediate outcomes and it is incumbent on boards to provide managers with the time necessary for truly active approaches to deliver. However, in our view the power for boards to enact a manager change as a last resort is one that is a net benefit to investors.
Mandate and policy changes
Boards are capable of completely renewing the strategy of a trust if they believe the existing approach is no longer in the best interests of shareholders or has become unsuited to a changing world and markets. One of the most dramatic changes in recent times occurred in February 2021 with the switch of mandate of Keystone Positive Change (KPC). As discussed in our previous article, the board proposed changing the strategy from being a UK-focussed mandate targeting income and growth to a global all-cap portfolio with a dual target of achieving capital growth and contributing to the transition to a more sustainable global economy, a switch shareholders agreed with and voted to support at their AGM. Kate Fox and Lee Qian of Baillie Gifford subsequently became named managers of the trust. Although too early to declare this change a success or not, it does represent a bold move by a board to completely reinvent a trust and attempt to give it a new lease of life.
Typically, boards will make far less drastic changes to enhance a trust’s strategy. In the case of the Martin Currie Global Portfolio (MNP) this included adding gearing in November 2020, a feature the trust had not employed previously. This, along with scrapping performance fees in favour of a simpler tiered management fee, was designed to give MNP a fresh appeal in the competitive global equity sector. We consider these positive developments (as discussed in our last note on MNP) and believe they demonstrate how a board can add incremental value by refining the policies of a trust.
Another way a board can increase the attractiveness of a trust to investors is by revamping the dividend policy. A case in point is JPMorgan Japan Small Cap Growth & Income (JSGI). The board of JSGI decided that from April 2018 the trust would pay out 1% of the trust’s NAV as a dividend each quarter, leading to JSGI having a c. 4% annual yield. This action led to an immediate narrowing of the trust’s discount and, as we argue in our latest research note, this continues to be an attractive feature of the trust as it provides a source of income that diversifies a typical income investor’s portfolio. We note that there has been a trend over recent years with a number of trusts adding similar distribution policies, for example BlackRock Latin American (BRLA) amended their dividend policy to pay out 1.25% of NAV per quarter in May 2018. JPMorgan China Growth & Income (JCGI) followed JSGI in February 2020, introducing a policy of paying out 1% of NAV per quarter, and JPMorgan Asia Growth & Income (JAGI) had made a similar switch in 2017.
Alongside performance and financial related features, boards can implement policies relating to sustainability. This requires a more careful balancing act. Although boards will be attempting to better align the trust with the sustainability preferences of current (and possibly future) shareholders, some investors may not wish to potentially sacrifice financial returns to improve the sustainability credentials of the underlying portfolio. A board which has chosen to adopt a more sustainable approach was that of BlackRock North American Income (BRNA) which as at 29/07/2021 was renamed to BlackRock Sustainable American Income (BRSA) following a consultation with shareholders.
The manager was set a target whereby the ESG score and carbon emissions (as measured by MSCI ratings) should be favourable versus their reference benchmark, the Russell 1000 Value Index. As discussed in our recent research note, the renewed mandate includes opening up opportunities in the US mid-cap space which we believe should see an overall benefit to shareholders. In addition, we identified two trusts other than KPC and BRSA that changed their investment policies in 2021 to include sustainability considerations, Dunedin Income Growth (DIG) and Odyssean Investment Trust (OIT). In 2020 there was one such change, Premier Global Infrastructure (PGIT). We did not identify any such policy changes prior to 2020.
Conclusion
We have explored several areas to determine whether boards are becoming more active. We have observed the continued decline in fees, however would note this trend has been in place for a number of years and is at least partly driven by competition, so not definitive proof of rising board activism. Additionally, we looked at manager changes; 2020 saw a definite uptick in the number of manager changes in the conventional equity sectors, but it would be premature to declare a single year as hard evidence of a definite trend.
Lastly, we explored policy and mandate changes. There is evidence of boards responding to the rise of sustainable investing, but again whether this is a sign of a rise of board activism or a reaction to investor demand and market competition is an open question. The same could be said for the trend in changing dividend policies to use capital to pay income.
Overall, there is evidence of rising board activism, but at this point not enough to declare a definite conclusion. However, we would note that whatever view an investor takes on the overall trend in the space, an important consideration for any particular investment decision will be how a shareholder views a board and the likelihood they will actively exercise their powers on behalf of investors.
Brokers Commentary » Brokers Latest » Commentary » Investment trusts Commentary » Investment trusts Latest » Latest » Mutual funds Commentary » Take control of your finances commentary
Leave a Reply
You must be logged in to post a comment.